Connections, the day and the tour
The instruments look at one condition at a time. These three views look at the whole case at once, and they're the first three rows of the case panel: How it all connects, A day in the patient's body and Take the guided tour.
How it all connects
Several of the patient's diagnoses are linked, and a few are separate stories. How it all connects (or Connections at the top) draws them as threads on the body: each condition gets a label at its place on the body, and eighteen threads run between them, with small pulses moving along each one.
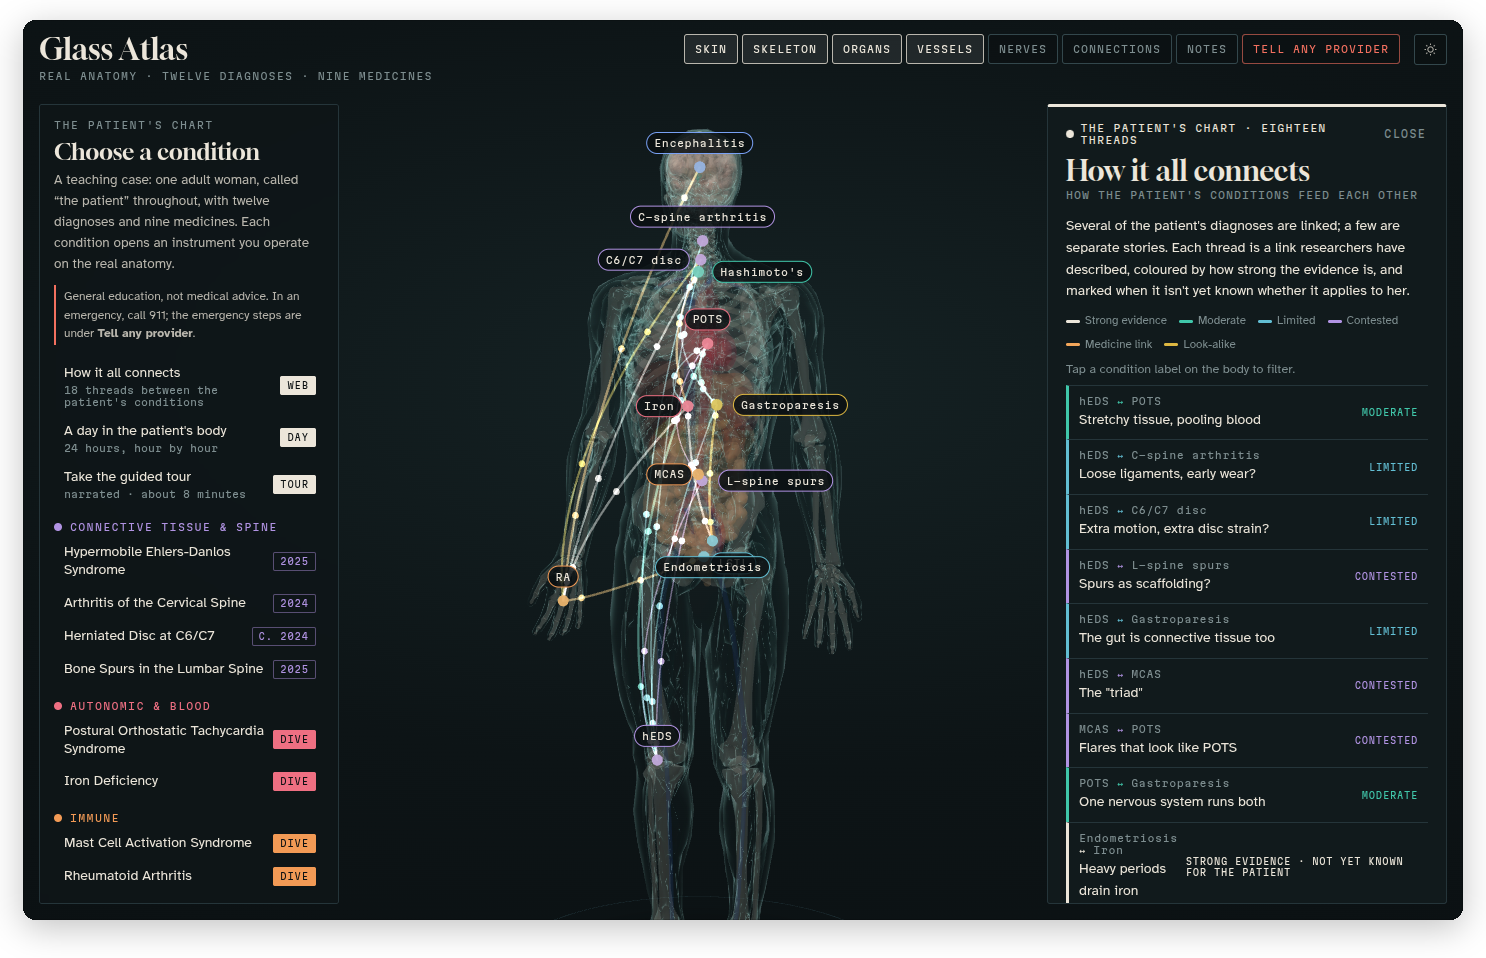 The connections web: the condition labels on the body, the threads between them, and the list of threads with the strength of each.
Each thread is a link that researchers have described, and it's coloured by how strong the evidence is:
- Strong: consistent large studies, or an established mechanism
- Moderate: repeated observational studies
- Limited: small, single-centre or expert-opinion evidence
- Contested: studies using strict criteria haven't confirmed it
There are also "Medicine link" threads, which come from a medicine's label or a guideline, like the four hours between the thyroid pill and iron, and "Look-alike" threads, for two causes that can look the same. A thread is also marked when it depends on something not yet known for the patient, since a link that's well proven in general can still be unknown for one person.
Tap a condition's label on the body to see only its threads, or pick a thread from the list in the drawer to light it up and read what it is. Basically, co-occurring doesn't prove that one condition causes the other, and this view is careful to say which links are solid and which aren't.
A day in the patient's body
A day in the patient's body is an imagined but typical day, 24 hours you can scrub through. Drag the slider under the clock, or press Play the day and watch it go by.
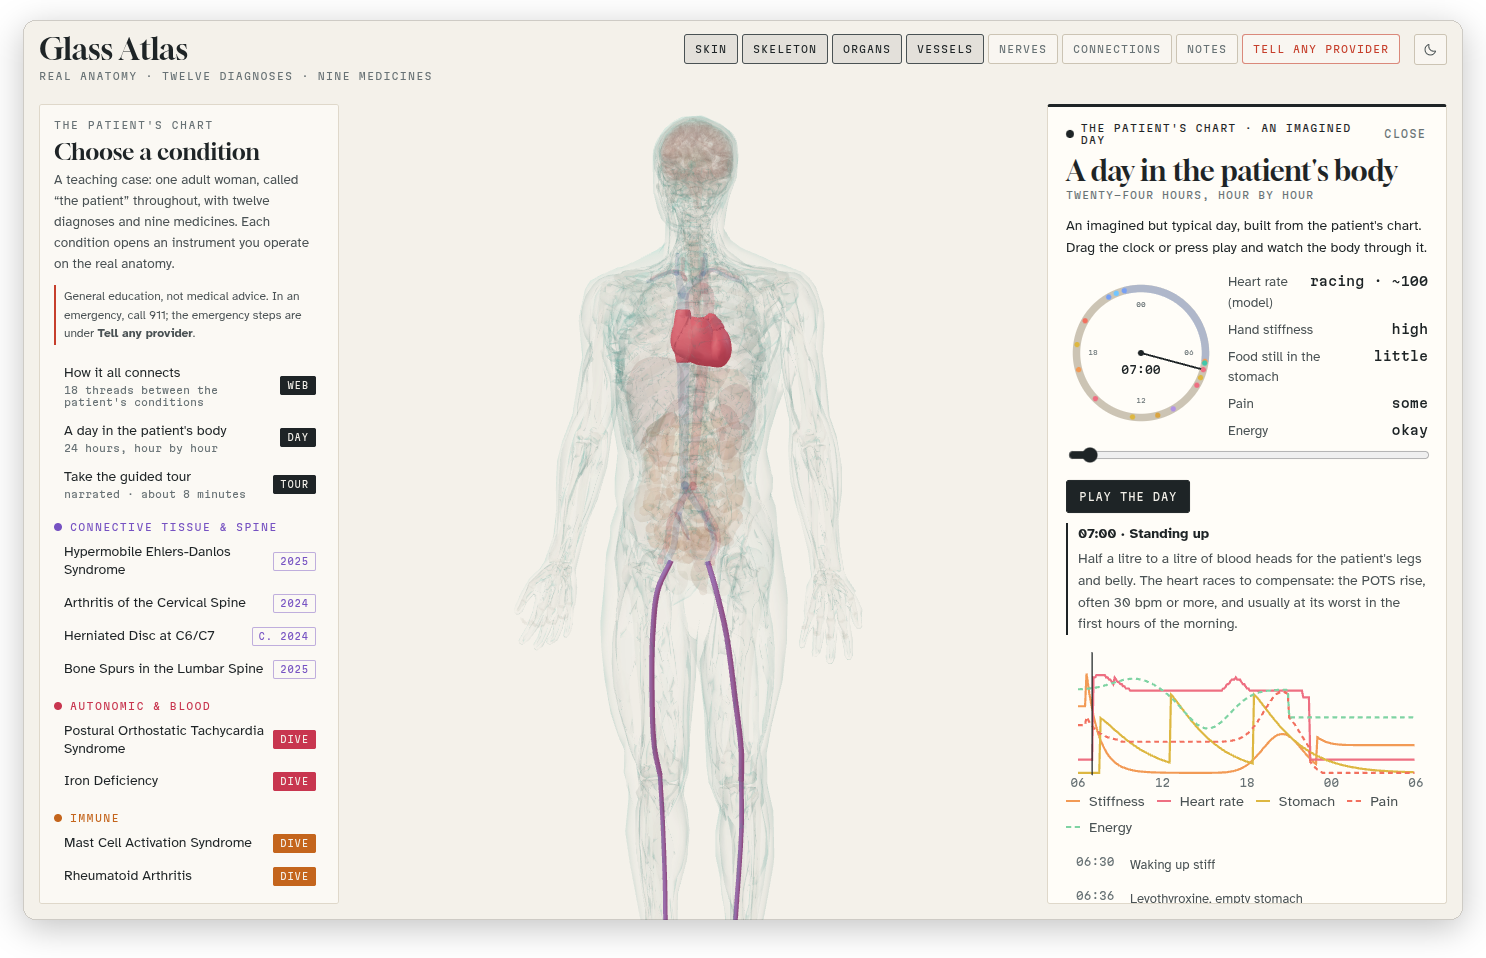 The day view in light mode at seven in the morning: the clock, the readouts for that hour, the event (standing up), and the curves for the whole day.
As the hours pass, the readouts change (the heart rate, the hand stiffness, the food still in the stomach, the pain and the energy, all from a model), the chart below shows those curves across the whole day, and the body lights up wherever the day is happening. The events are listed with their times, from "Waking up stiff" and "Levothyroxine, empty stomach" through "Standing up", "Head down at a desk" and "Lunch, and nausea" to "Ice packs" and "Protecting sleep". Click one to jump to it, and the card says in a few sentences what's going on in the body at that moment and why.
The guided tour
Take the guided tour is the quickest way into the atlas: thirteen stops, narrated, about eight minutes in all. It starts with what the atlas is, goes through the connective tissue, the neck and the lower back, standing up, iron, mast cells, the hands, the thyroid, the stomach, the brain and the pelvis, and ends with how it all connects. At each stop the camera flies to the part of the body it's about and the right structures light up, while the narration plays and the words appear in the bar at the bottom.
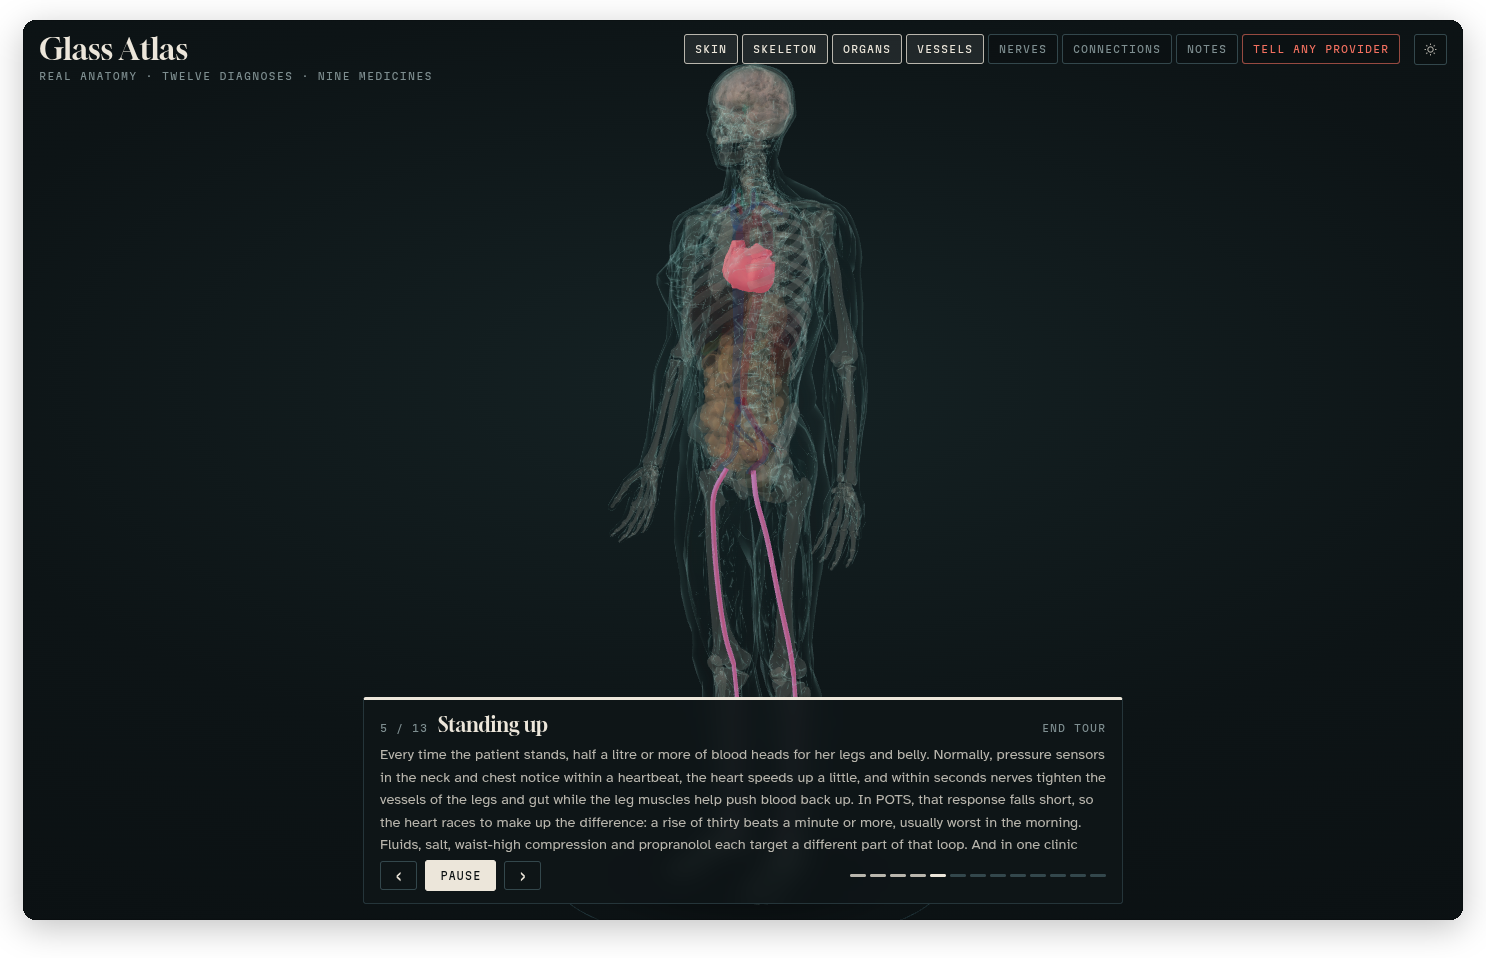 The tour at stop 5 of 13, standing up, with the leg veins lit.
The bar has ‹ and › for the previous and the next stop, Pause and Play, a dot for each stop, and End tour. On a computer, the arrow keys move between stops and Escape ends the tour. If the audio can't play, the tour still runs, with the text on its own and a pause long enough to read it.
Every stop has its own instrument, so when the tour is over, open the condition that caught your eye and try it yourself.